Understanding Technical Analysis

Technical analysis is the study of historical asset prices so as to forecast potential future price action. The underlying belief in technical analysis is that history tends to repeat itself, and within the seeming randomness of price changes in the market, patterns can be identified and exploited to a trader’s advantage. It is also assumed that all information available about an underlying asset has been discounted in its price at any given time.
So, to start with, the only important parameters to a technical analyst are price and time, nothing more. To observe and decipher these parameters, technical analysts use charts and indicators. Let’s look into this in more detail.
Charts
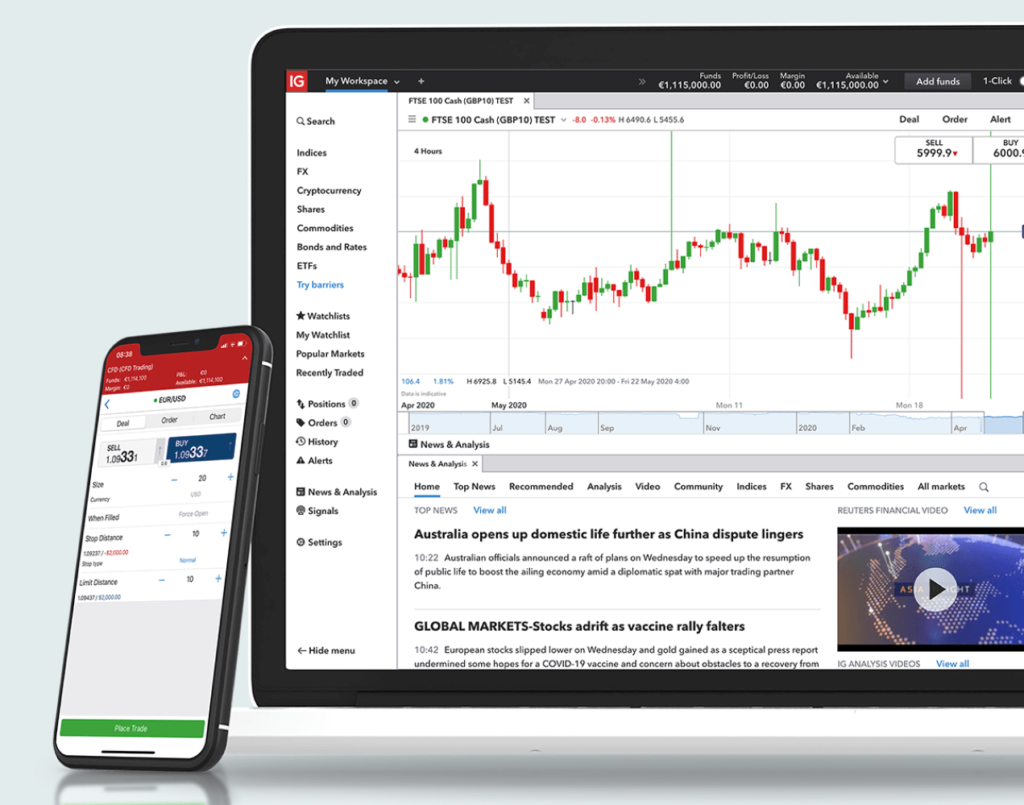
Charts are the basis of technical analysis. They provide a graphical or visual representation of an asset’s price over a period of time. The price of a chart is constant, but traders can change timeframes. You can watch how price changes on a 1-hour, 4-hour, or any other timeframe chart that you wish depending on your underlying trading strategy.
There are basically 3 types of charts available to retail traders:
- Line Charts
Line charts are constructed by connecting the closing prices of an asset over a set period of time. They are simple to follow because they provide a clear illustration of an asset’s price trend in just a simple look. Line charts also make it easy to mark out important support and resistance areas in the market.
- Bar Charts
While line charts only factor in closing prices during each time period, bar charts are more comprehensive. Each price bar highlights opening, high, low and closing prices achieved during each time period. This additional information can help traders decipher more about the price action that happened during a particular time.
- Candlestick Charts
Candlesticks charts are a variation of bar charts, but they are more visually appealing. They also feature opening, high, low, and closing prices; but their aesthetic nature has made them more popular among retail traders. They make reading price action simple and exciting.
Some technical analysts rely purely on charts to perform their trading operations. This style of trading is referred to as price action trading, where traders watch prices on a ‘naked’ chart exclusively to determine entry and exit points. Such traders watch out for candlestick types, candlestick patterns, support and resistance levels, as well as trendlines.
However, other technical analysts require more tools to perform their trading operations. Such traders utilize indicators.
Indicators
Indicators are mathematical tools that are added to a chart to help technical analysts understand more about price action. These indicators help generate signals for traders so that they may make more effective trading decisions in the market. There are broadly two types of indicators: leading and lagging. Leading indicators generate signals before an expected price move, thus alerting traders of an opportunity beforehand. On the other hand, lagging indicators generate signals after a price move has happened, effectively providing confirmation to traders that an opportunity is worth pursuing.
Indicators help traders read different elements of an asset’s price such as:
- Trend
Trend indicators help traders to establish and take advantage of the prevailing dominant trend in the market. A popular example of a trend indicator is moving averages. The slope of moving averages helps traders clearly see a dominant trend in the market.
- Momentum
Also known as oscillators, momentum indicators help traders establish overbought and oversold conditions in the market. A popular momentum indicator is the RSI. A basic RSI strategy is to buy an asset when the reading is below 30 (denoting oversold conditions) and to sell when the reading is above 70 (implying overbought conditions).
- Volatility
Volatility is the rate of price changes in the market. Volatility indicators help traders determine phases in the market where there is high or low volatility. A popular volatility indicator is Bollinger Bands, whose bands contract during phases of low volatility, and expand during phases of high volatility.
- Volume
Volume indicators help traders determine the volume of trades behind any particular move in the market. They help traders determine whether a price move is validly backed by sufficient volume or if it is just ‘noise.’
- Market Cycles
Market cycle indicators help traders decipher the current phase of price development in the market such as Price Rise, Peak, Fall, and Bottom Out. Market cycle indicators help traders put the current price action into perspective and attempt to forecast the next phase. One such indicator is Elliot Waves.
Final Words
For many beginners, technical analysis provides a simple and straightforward entry into the world of financial assets trading. But the approach has some limitations. It is prone to subjective or biased analysis, and in some instances, traders can receive mixed signals. Nonetheless, when mastered, technical analysis can provide a solid base for building a sound strategy that can deliver consistent success in the markets.
Alexia is the author at Research Snipers covering all technology news including Google, Apple, Android, Xiaomi, Huawei, Samsung News, and More.


