The AI Revolution: A Closer Look into the Top 10 AI Tools and Their 24 Billion+ Traffic Behaviors

Artificial intelligence (AI) has transformed the way we interact with technology and is redefining industries across the globe. The year-long analysis from September 2022 to August 2023, conducted by Sujan Sarkar at writerbuddy.ai, offers a fascinating glimpse into the AI industry’s rapid growth and the standout performers within it.
AI Dominance: A Complete Picture of 24 Billion+ Visitors
In an ambitious study encompassing over 3,000 AI tools, the findings are nothing short of impressive. These AI tools collectively drew 24 billion visits during the specified period. Among them, ChatGPT emerged as the undisputed champion, attracting 14 billion visits. This translates to an astonishing 60% of the total traffic generated by the top 50 visited AI tools during the study period.

Shining Stars and Shadows
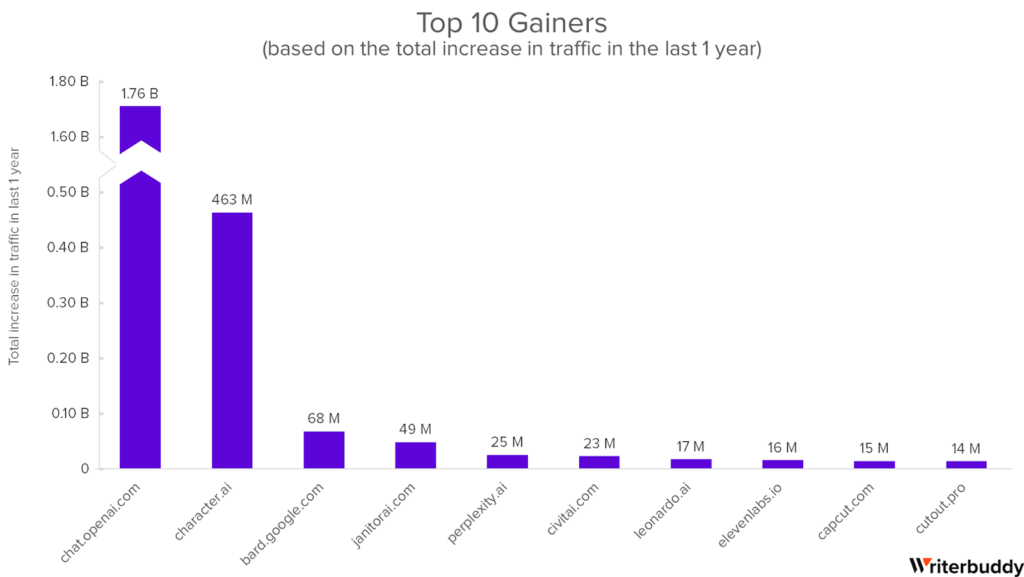
While ChatGPT’s meteoric rise is a headline-grabber, other AI tools have also made significant contributions. Character AI, for instance, secured an impressive 3.8 billion visits, with an average monthly visit rate of 318.8 million. Google Bard, another AI chatbot, joined the ranks with 241.6 million total visits and a monthly average of 34.5 million. These platforms experienced net traffic growths of 463.4 million and 68 million visits, respectively – which demonstrates their appeal to users.
However, not all AI tools basked in the same limelight. Craiyon, MidJourney, and Quillbot faced substantial declines in traffic during the same period. This highlights the fiercely competitive and ever-evolving nature of the AI industry.
Cracking the Code
The research methodology employed by writerbuddy.ai was both rigorous and comprehensive. Leveraging the power of SEMrush, a leading SEO tool, they collected data from AI tool directories and meticulously filtered it down to the 50 most visited AI tools. This careful curation ensured that the analysis focused on the industry’s heavy hitters, providing a holistic view of the AI industry’s digital footprint.
Key Insights from the AI Traffic Analysis
The data generated from this extensive study offers a wealth of insights into the AI industry’s traffic behavior and its evolving landscape:
1. Massive Traffic Surge: Over the span of a year, from September 2022 to August 2023, the AI industry experienced a remarkable growth spurt. Starting with 241.8 million visits, the top 50 AI tools soared to a staggering 2.8 billion visits by the end of the study. This represents an average monthly growth of 236.3 million visits.
2. ChatGPT’s Triumph: ChatGPT’s journey is emblematic of the AI industry’s ascent. Within five days, it reached the milestone of 1 million users, propelling the industry to a peak of 4.1 billion visits in May 2023. Even after a subsequent dip of 1.2 billion visits, the latter half of the year still maintained an impressive average of 3.3 billion monthly visits. This trend suggests that investments in leading AI tools could yield substantial returns, potentially ranging from 3-10x.
3. Global Player Rankings: The analysis revealed the global distribution of AI tool users. The United States led the charge, contributing a significant 5.5 billion visits, followed by Europe with a total of 3.9 billion visits. This geographical breakdown underscores the worldwide reach of AI technologies.
4. Gender Disparity: In terms of user demographics, the data shows a gender disparity in AI tool usage, with 69.5% of users being male and 30.5% female. This gender gap within the AI industry is a notable trend, warranting further exploration.
5. Mobile Accessibility: Accessibility played a pivotal role, with 63% of users accessing AI tools via mobile devices. This emphasizes the importance of mobile-friendly AI applications and the need for seamless user experiences on smartphones and tablets.
Top 10 Popular AI Tools Right Now
The top 10 AI tools in the study provide a snapshot of the diverse offerings within the AI industry. Let’s go deep into their performances and contributions:

1. ChatGPT
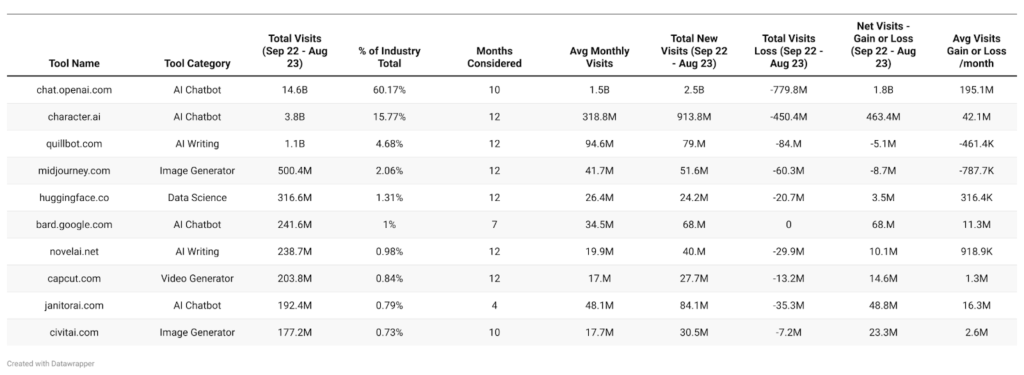
This AI chatbot tool emerged as the undisputed leader, amassing a monumental total traffic of 14.6 billion visits. With an average of 1.5 billion visits every month, it dominated the chart, accounting for a staggering 60.17% of the entire traffic. This platform witnessed a positive net traffic growth of 1.8 billion visits which translates to an average monthly growth of 195.1 million visits.
2. Character AI
Character AI, another AI chatbot, garnered significant attention with a total of 3.8 billion visits. With an average monthly visit rate of 318.8 million, it contributed to 15.77% of the overall traffic. It experienced a commendable net traffic increase of 463.4 million, equating to an average monthly growth of 42.1 million visits.
3. QuillBot
Specializing in AI writing, QuillBot attracted a total of 1.1 billion visits over the year. With an average monthly visit rate of 94.6 million, it represented 4.68% of the total traffic. However, it faced a slight decline with a net loss of 5.1 million visits which equates to an average monthly loss of 461.4K.
4. Midjourney
Imagine an AI-powered image generator platform that drew a total of 500.4 million visits. Yes, this is Midjourney! With a monthly average of 41.7 million visits, it constituted 2.06% of the entire traffic. Unfortunately, the platform experienced a decline, with a net traffic loss of 8.7 million visits, averaging a monthly dip of 787.7K.
5. Hugging Face
Catering to data science enthusiasts, Hugging Face secured a total of 316.6 million visits. With its monthly visits averaging at 26.4 million, it contributed to 1.31% of the total traffic. Positively, it saw a net growth of 3.5 million visits or an average monthly gain of 316.4K.
6. Google Bard
Another entrant in the AI chatbot category, Google Bard had a total traffic of 241.6 million. Its monthly average stood at 34.5 million, comprising 1.00% of the total traffic. The platform enjoyed a net growth of 68 million. Which means it gained an average monthly increase of 11.3 million.
7. NovelAI
NovelAI, an AI writing tool, recorded a total of 120.7 million visits. Its monthly average was 10.1 million, making up 0.50% of the complete traffic. The tool experienced a positive net growth of 10.1 million visits, translating to an average monthly gain of 900K.
8. CapCut
Focusing on AI-driven video generation, CapCut witnessed a total of 108.2 million visits. With its monthly average being 9.1 million, it accounted for 0.45% of the total traffic. The platform saw a net growth of 14.6 million, averaging a monthly increase of 1.3 million.
9. JanitorAI
Another chatbot AI tool, JanitorAI, accumulated a total of 86.7 million visits. Its monthly average came to 7.2 million, constituting 0.36% of the total traffic. Encouragingly, the platform enjoyed a net growth of 48.8 million which equates to an average monthly gain of 4.1 million.
10. Civitai
Civitai is an AI image generation tool that secured a total of 60.2 million visits. With a monthly average of 5 million, it made up 0.25% of the total traffic. The platform experienced a positive net traffic growth of 7.1 million visits. Which means it gained an average monthly growth of 636.4K.
Last Words
The AI industry’s rapid growth and its ever-evolving nature make it an exciting space to watch. The top 50 AI tools collectively attracted over 24 billion visits over a year, showcasing AI’s pervasive influence. As the AI landscape continues to transform, it is crucial for AI tool developers to stay agile, innovative, and adaptive to cater to users’ evolving needs worldwide.
With AI technologies becoming deeply integrated into our lives, the dynamic industry promises both challenges and opportunities. The rise and dominance of tools like ChatGPT underscore AI’s profound impact on our digital lives. As AI continues to advance and reshape various sectors, its future remains bright and promising.
Research Snipers is currently covering all technology news including Google, Apple, Android, Xiaomi, Huawei, Samsung News, and More. Research Snipers has decade of experience in breaking technology news, covering latest trends in tech news, and recent developments.


